Diversified Ocean Freight Supply Chain Strategy
Overview
Companies engaged in international trade rely heavily on ocean freight transportation to move goods globally in a cost-effective manner. An effective ocean freight strategy is critical to balance service levels with shipping costs and overall supply chain efficiency. There are various options available including freight forwarders, non-vessel operating common carriers (NVOCCs), and direct contracted relationships with ocean carriers.
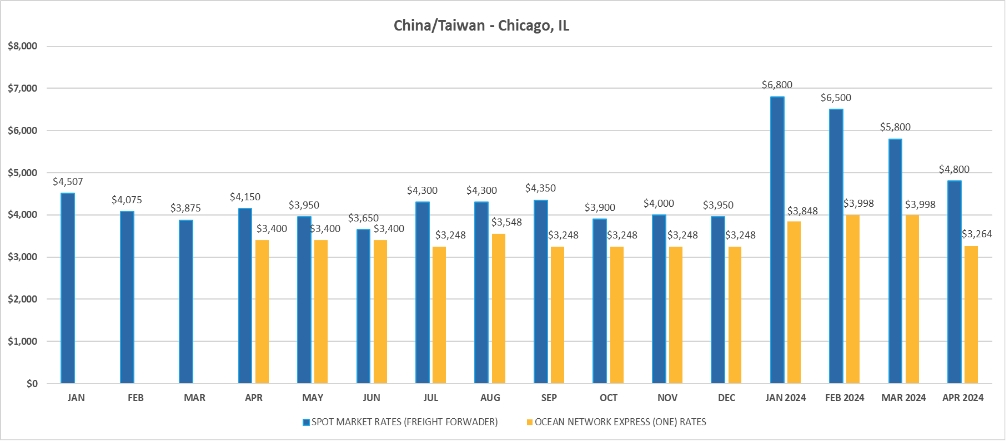
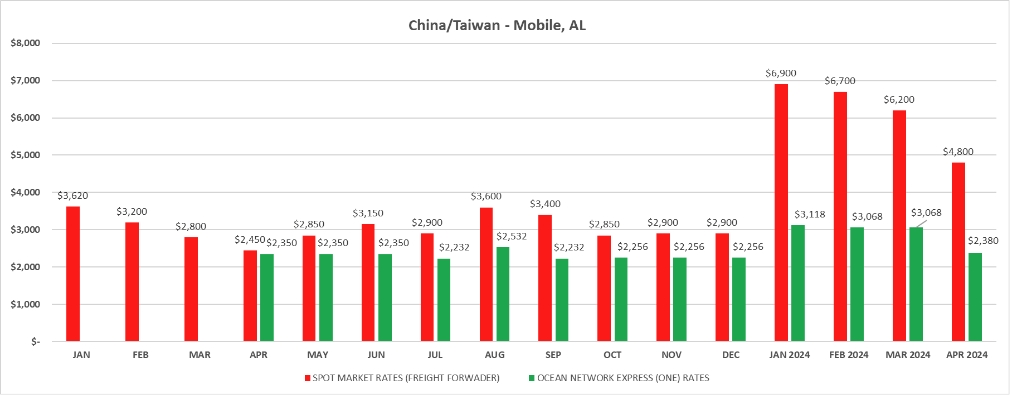
One strategic approach that both Luxor and Pradco have recently leveraged is a direct carrier relationship for a dedicated portion of the company’s ocean freight volume. By committing to an annual minimum volume with a carrier, we can negotiate favorable contracted rates that are significantly lower than and more resilient to market increases than volatile spot market rates typically offered through freight forwarders. This direct relationship provides guaranteed space allotment and avoids spot rate volatility.
While there are minimum commitment levels required, both companies have realized substantial savings compared to the spot market.
Result
$537,795 green dollars in savings by adding this into the ocean freight strategy.
2023/2024 Ocean Contracts
- Contract Term: 07/13/2023 – 05-31-2024
- Contracted Rates Volume (Ocean Network Express – ONE): 60%
- Market Rates Volume: 40%
2023/2024 Forecast (Total Container Volume)
- LUXOR: 245 containers
- PRADCO: 261 containers
- BAILEY: 636 containers
2023/2024 Strategy
Mix of direct contracts with Ocean Carriers/Market rates with Freight Forwarders
Direct contract: Ocean Network Express (ONE)
Direct contract commitment: 300 containers (600 TEUS – twenty-foot equivalent units)
Direct contract free time: Extended container free time at destination to reduce per diem charges (steamship lines bill “per diem” fees for each day container is pulled out of port/rail yard after free time expires. Average “perdiem” fee is $200 – $350/per day) Ocean Network Express offers 10 free days. Freight Forwarders offer 4 free days on the average.
Market rates: utilizing Freight Forwarders for overflow volume, additional space and capacity options
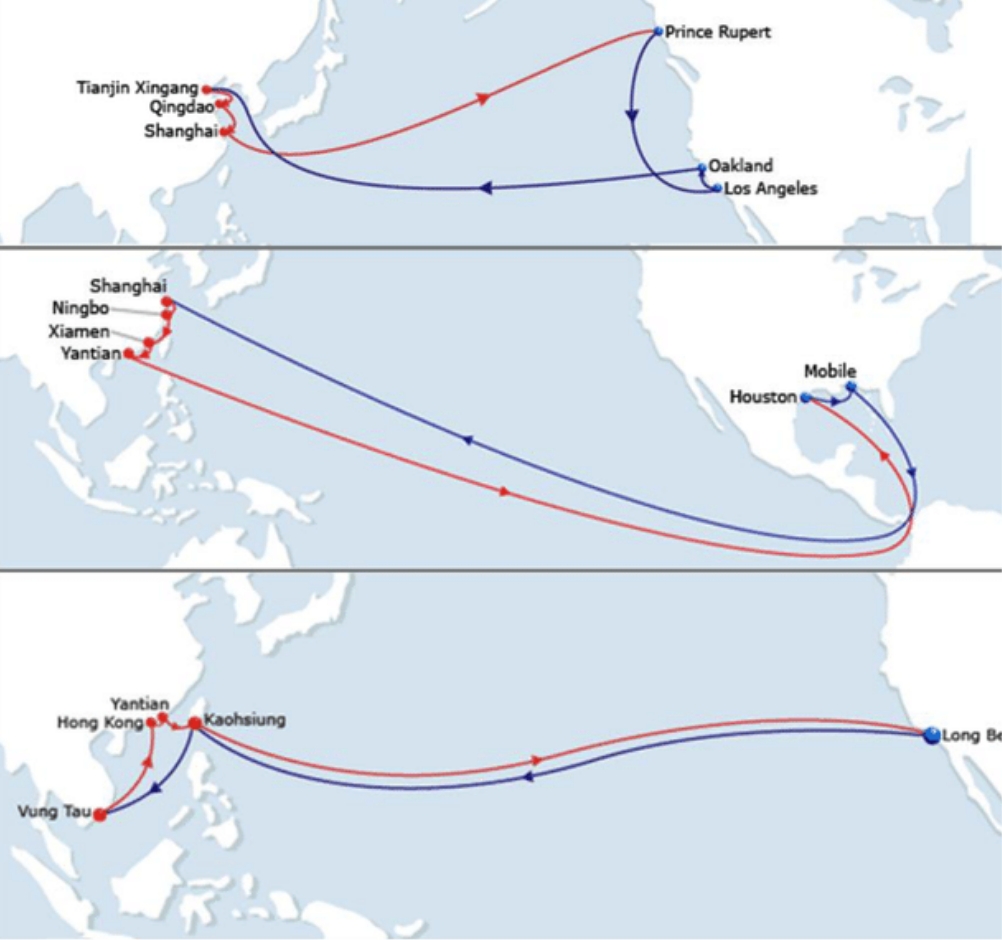
Potential Trade Lanes
July 2023 – April 2024
- Containers moved with Ocean Network Express (ONE): 157Average Savings Per COntainer: $1,473Total estimated savings: $231,261
July 2023 – April 2024
- Containers moved with Ocean Network Express (ONE): 122Average Savings Per COntainer: $1,181Total estimated savings: $144,082